Changing the metrics properties on the Microsoft Dynamics GP home page - Part 1
Part 1 of 2 - Changing the metrics properties on the Microsoft Dynamics GP home page.
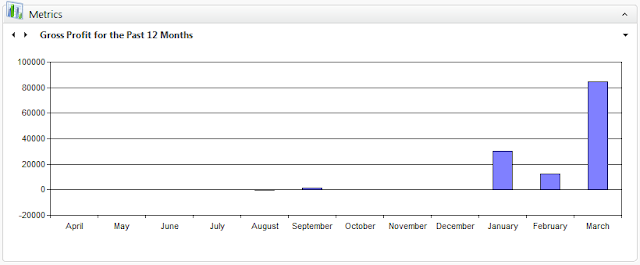
In this series I wanted to surface a little known secret about the standard Microsoft Dynamics GP Home Page metrics: you can change the graph properties...no coding required! In fact, there are many graph properties that can be changed.
Microsoft Dynamics GP makes use of the Office Chart Control, a component of the Microsoft Office Web Components to display the metrics that you have become accustomed to see on the home page -- see my article Microsoft Dynamics GP 2010 and Office Web Components for more information on the different versions supported.
When you right-click on the metric of your choice a menu becomes available that will allow you to choose from a number of options, as shown below.
Today we will be looking at the Data properties.
Data
The Data option presents the Commands and Options window with 3 tabs: Data Source, Data Sheet, Type... you have guessed correctly! You can make changes to what's being displayed on the metric by creating a new data sheet or reading data from a query. However, this information will be lost as soon as you refresh the home page.
Perhaps, the option that's most important at this point is the Data Sheet option. The Data Sheet option shows the numbers crunched by GP for each category and series of the metric being displayed.
The good thing about the Data Sheet tab is, you can actually use the numbers displayed to reconcile against your subsidiary module, since that's the source of the data for all metrics.
Finally, the Type tab allows you to change the type of graph being displayed. Most metrics are set to display bar graphs by default, but you can make a subtle change to the type of graph to enhance your reading of the data being presented.
The series continues tomorrow exploring some of the other properties available to you as a user.
Until next post!
MG.-
Mariano Gomez, MVP
IntellPartners, LLC
http://www.intellpartners.com/

In this series I wanted to surface a little known secret about the standard Microsoft Dynamics GP Home Page metrics: you can change the graph properties...no coding required! In fact, there are many graph properties that can be changed.
 |
| Gross Profit for the Past 12 Months sample metric |
Microsoft Dynamics GP makes use of the Office Chart Control, a component of the Microsoft Office Web Components to display the metrics that you have become accustomed to see on the home page -- see my article Microsoft Dynamics GP 2010 and Office Web Components for more information on the different versions supported.
When you right-click on the metric of your choice a menu becomes available that will allow you to choose from a number of options, as shown below.
Today we will be looking at the Data properties.
Data
 |
| Command and Options window - Data Source tab |
The Data option presents the Commands and Options window with 3 tabs: Data Source, Data Sheet, Type... you have guessed correctly! You can make changes to what's being displayed on the metric by creating a new data sheet or reading data from a query. However, this information will be lost as soon as you refresh the home page.
Perhaps, the option that's most important at this point is the Data Sheet option. The Data Sheet option shows the numbers crunched by GP for each category and series of the metric being displayed.
 |
| Command and Options window - Data Sheet tab |
Finally, the Type tab allows you to change the type of graph being displayed. Most metrics are set to display bar graphs by default, but you can make a subtle change to the type of graph to enhance your reading of the data being presented.
 |
| Commands and Options window - Type tab |
The series continues tomorrow exploring some of the other properties available to you as a user.
Until next post!
MG.-
Mariano Gomez, MVP
IntellPartners, LLC
http://www.intellpartners.com/

Comments
Mark
That would definitely be a cool thing if you could. Unfortunately, the changes are not permanent.
The way I see this being used is more as a way to analyze your results in a different way, in addition to being able to cut/paste your changes to some report or document you may be working on.
MG.-