SQL Server Management Studio Standard Reports
 If you have worked with SQL Server Management Studio (SSMS) in either Microsoft SQL Server 2005 or Microsoft SQL Server 2008, you may have inadvertly overlooked one of its key features: Standard Reports.
Standard Reports are Reporting Services (SSRS) reports that can provide all sort of statuses and and information about the database engine and its management components and well as the databases themselves in real time -- the reports are refreshable! When executed, the reports are embedded in tabs within a new SSMS tab. As a consultant, I find these reports particularly useful when attempting to establish the health of a Microsoft Dynamics GP SQL Server installation. I can immediately relay critical SQL Server performance information to my clients and suggest preventative or corrective actions to mitigate the issues, saving them money in the process.
So lets take a look at the available reports by node...
| Node | Report |
| Server | Server Dashboard |
| Server | Configuration Changes History |
| Server | Schema Changes History |
| Server | Scheduler Health |
| Server | Memory Consumption |
| Server | Activity – All Blocking Transactions |
| Server | Activity – All Cursors |
| Server | Activity – Top Cursors |
| Server | Activity – All Sessions |
| Server | Activity – Top Sessions |
| Server | Activity – Dormant Sessions |
| Server | Activity – Top Connections |
| Server | Top Transactions by Age |
| Server | Top Transactions by Blocked Transactions Count |
| Server | Top Transactions by Locks Count |
| Server | Performance – Batch Execution Statistics |
| Server | Performance – Object Execution Statistics |
| Server | Performance – Top Queries by Average CPU Time |
| Server | Performance – Top Queries by Average IO |
| Server | Performance – Top Queries by Total CPU Time |
| Server | Performance – Top Queries by Total IO |
| Server | Server Broker Statistics |
| Server | Transaction Log Shipping Status |
| Database | Disk Usage |
| Database | Disk Usage by Top Tables |
| Database | Disk Usage by Table |
| Database | Disk Usage by Partition |
| Database | Backup and Restore Events |
| Database | All Transactions |
| Database | All Blocking Transactions |
| Database | Top Transactions by Age |
| Database | Top Transactions by Blocked Transactions Count |
| Database | Top Transactions by Locks Count |
| Database | Resource Locking Statistics by Object |
| Database | Object Execution Statistics |
| Database | Database Consistency History |
| Database | Index Usage Statistics |
| Database | Index Physical Statistics |
| Database | Schema Changes History |
| Database | User Statistics |
| Database | Active Full-Text Catalogs |
| Logins | Login Statistics |
| Logins | Login Failures |
| Logins | Resource Locking Statistics by Logins |
| Management | Tasks |
| Management | Number of Errors |
| Notification | Services General |
| SQL Server Agent | Job Steps Execution History |
| SQL Server Agent | Top Jobs |
To access a specific report, just right-click on the desired node then choose Reports > Standard Reports, select the desired report. The following is an example of the navigation to the Server node reports.
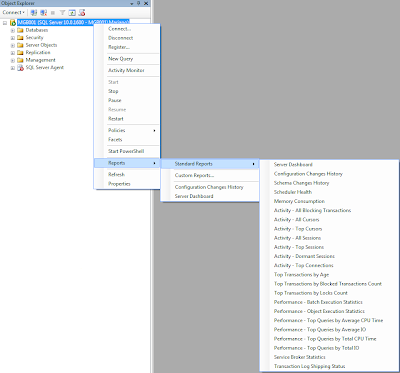
Lets take a look at some sample standard reports...
Server Dashboard report (server > Reports > Standard Reports > Server Dashboard)
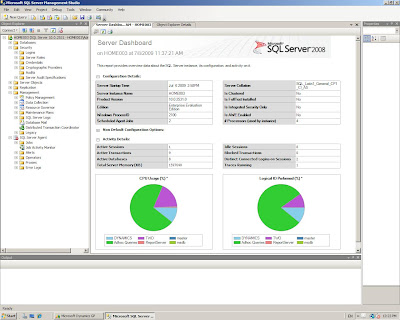
This report provides detailed configuration information including, but not limited to the SQL Server startup time, product version and edition, server collation, the number of processors in used by the SQL Server instance, CPU usage by database, and number of active databases.
Disk Usage by Top Tables report (database > Reports > Standard Reports > Disk Usage by Top Tables)
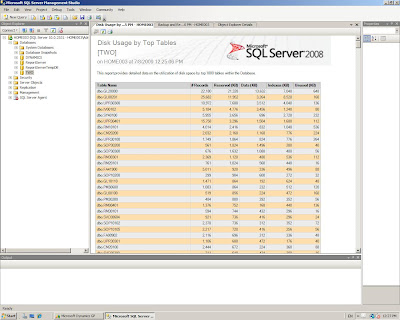
This reports shows vital table information such as the number of records in the table, the amount of disk space reserved for the table, spaced occupied by data and indexes, and the unused space. This information can be used to plan for disk space optimization and establish whether it will be necessary to increment the number of partitions or relocate the databases.
Backup and Restore Events report
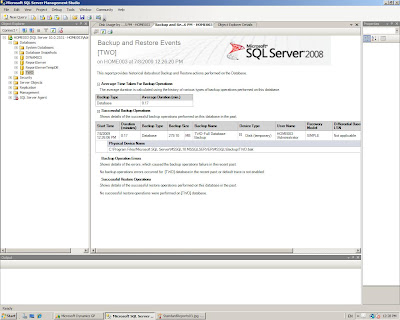
This one is got to be one of the most important database level reports as it shows statistics about the backups completed on a specific database: average time, size of backups, whether the database backup was complete or differential, etc.
I hope you like this SQL Server gem and start to explore these reports. There is valuable information that can be used to administer your Dynamics GP and overall SQL Server environment.
Until next post!
MG.-
Mariano Gomez, MIS, MCP
Maximum Global Business, LLC
http://www.maximumglobalbusiness.com/
Comments