Support Debugging Tool Redux
Let me start by saying, if you are not using Support Debugging Tool you really are making things more difficult for yourself than you should!
Back in August, I was part of a selected group of beta testers and was introduced to the tool, and have since writen a number of articles about it, including my First Look article, which also got featured in MSDynamicsWorld.com. Back then, I presented some of the coolest features I had had the opportunity to explore in detail. This time, David Musgrave does it again with this revised version. Let me say it again just in case: if you are not using Support Debugging Tool you are truly making things more difficult than they should for yourself.
This build of Support Debugging Tool has been enhance with a number of performance improvements and now introduces two new features I believe will blow you away: Security Profiler and Screenshot capturing.
Security Profiler
Security Profiler is by far the most notorious new feature in Support Debugging Tool. Short of talking, this feature has been enhanced to provide detail information about security issues as they are happening and can be setup to trap [security] errors automatically and instantly when they occur. In addition, users now have the ability to export the security log to an XML document that can be uploaded by administrators for troubleshooting purposes -- no more guessing what security roles and security tasks are out of wack!
As the security log is built, Security Profiler identifies the state of the object being accessed, this is, whether the object is original, modified, or alternate modified. This also improves the chance of detecting whether the user is seing the right object to begin with.
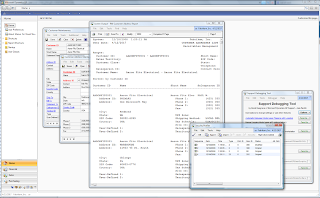
* Click on image to enlarge
Once the security log is built to the point of an error condition, the user can then export the log to an XML file that can be used by an administrator to troubleshoot the problem. Once the administrator imports the file, he or she can pretty much replay the sequence of actions leading up to the security error condition.
Now get this!
Through each step, the administrator can right-click -- you read correctly! Right-click! -- on the object to obtain detail security information. The Security Information window is the brain of the Security Profiler and breaks down the security tasks and roles associated with the current user, and further more, provides information at the system level of all the tasks and roles with access to the object.

* Click on image to enlarge
Long gone are the days trying to figure out what roles and tasks are associated to what objects. You can also double-click on a role or a task to obtain more information. This will open up standard GP security windows.
Screenshot Capturing
Support Debugging Tool adds a new shortcut for those of you who love to find interesting shortcuts in GP, that is CTRL + S. Screenshot Capturing is a new powerful tool included as part of this new build of Support Debugging Tool. It does as the name suggests, with a twist: it allows the user to incorporate in an email valuable troubleshooting information such as a copy of the DEX.INI settings file, the DYNAMICS.SET launch file, and a complete System Summary of the user's workstation. How is this important? Ever wonder if the user is pointing to the correct REPORTS.DIC or FORMS.DIC dictionary files? Ever wonder as an administrator if the user is missing a customization? Ever wonder if the user machines is missing some GP service pack? All these questions are answered with this feature.

The email is jammed pack with information for administrators and will definately take the guessing game out of troubleshooting. One note though, Support Debugging Tool will not be able to capture screenshot images for modal dialogs and error conditions, these will have to be captured through traditional print screen methods and submitted in addition to, or as additional attachments to your email.

* Click on image to enlarge
Please visit David Musgrave's blog, Developing for Dynamics GP, for his release notes on this new exiting build of Support Debugging Tool.
Downloads
Support Debugging Tool Build 10 is available from PartnerSource. Please use the following links to obtain a copy or contact your Microsoft Partner for more information.
Support Debugging Tool for Microsoft Great Plains 8.0
Support Debugging Tool for Microsoft Dynamics GP 9.0
Support Debugging Tool for Microsoft Dynamics GP 10.0
Until next post!
MG.-
Mariano Gomez, MIS, PMP
Maximum Global Business, LLC
http://www.maximumglobalbusiness.com/


Comments
Open the Resource Info window from the SDT main menu.
Change the search mode to 'contains' and then enter a common window, eg "Sales Transaction" into the Display Name field. Once you move off that field (eg TABbing), it will find a matching window. Hit the [Search Again] a couple more times.
Choose the [Security] button - you are now at the Security Info window with the window you wanted to know more about, without having to use the Profiler.
But we haven't finished. It defaulted to your current Userid and Company. So go and change to the user or company that you are having some issue with!
Ok, so you can now see where the issue and what to fix it - use the GOTO button in the top right corner to get straight to the appropriate security setup windows.
------
Robert
I am glad you are enjoying the tool as much I am.
Best regards,
MG.-
Mariano Gomez, MVP
Maximum Global Business, LLC
http://www.maximumglobalbusiness.com
Why the download is not available at Customer Source? Anyway to get this?
Cheers,
Sugih
Support Debugging Tool is only available via PartnerSource, hence you may contact your Microsoft partner to request a copy.
Best regards,
MG.-
Mariano Gomez, MVP
Maximum Global Business, LLC
http://www.maximumglobalbusiness.com
The partner sets up and leaves, but the customers stays to support organization changes, new users, new organization roles, etc.
Unfortunately, that's was more of a Microsoft decision. In all fearness to MS partners, they had no bearing in this decision.
I got a lot of feedback from Convergence from individuals like yourself requesting SDT be available directly to customers and perhaps this should be entered as a product suggestion. I guess this would be the best forum to request SDT availability via CustomerSource.
MG.-